You should spend about 20 minutes on this task.
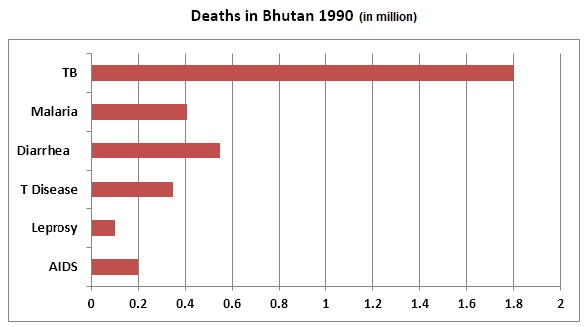
The bar graphs below show information on the death in Bhutan in 1990 from different diseases and Medical Research funding for those diseases.
Summarise the information by selecting and reporting the main features, and make comparisons where relevant.
Sample Answer:
The diagrams present a comparison data on medical research funding on six diseases in Bhutan and deaths from these diseases in 1990. As an overall trend, the higher the funding on the medical research for a disease, the lower the losses of life from this sickness, according to the statistics given.
To illustrate, the highest research funding was for AIDS in Bhutan, almost 180 million USD, and it was far more than the money spent on research for any other disease. Interestingly only 0.2 million people died of AIDS in 1990 in contrast to the 1.8 million TB-related deaths in the same year. It is worth noticing that medical research funding for TB was only around 40 million dollars, the lowest, and this disease caused the highest casualties. The second highest fund was spent on experimenting and finding cures for Leprosy and T Disease which was roughly 75 million dollars each and 0.1 and 0.4 million people were deceased due to these two diseases respectively. Around 0.4 to 0.5 million deaths from Malaria and Diarrhea were recorded in Bhutan in the same year and medical research for these diseases was somewhat 50 to 70 million USD.
In summary, more the money went on medical research in Bhutan, the less the casualty that diseases caused in general in 1990.


Good.